$275/Month
It is impossible for a Manager to have any claim of being a “true professional” in any field without knowing the norms of quality and cost. MVI Benchmarking gives Managers this professional perspective in 20 seconds! The software allows a Hospice to compare itself with 760+ other Hospices using 989 data-points for each organization! And the data extraction is automated! Whoa!
Click Here to View the Benchmarking System Demo
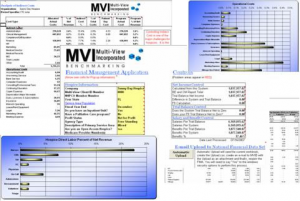
The Benchmarking System is a reporting system that not only provides a powerful set of reports for financial management, but also the ability for a Hospice to compare its performance with other Hospices based on user-defined criteria in seconds. And it’s automated! This system does not require the manual and time-consuming completion of forms. You simply process your normal accounting transactions and the system does the rest with absolute minimum effort. Here’s how it works:
 Management Application
The Management Application is installed on your Hospice network. Training on how to configure and use the system is provided along with unlimited technical support. Data is extracted from your accounting system thus eliminating manual entry or the completion of forms. Regardless of the brand of the accounting system or its configuration, the Management Application extracts and groups your data into standardized and meaningful reports based on time-proven management best practices. At present, over 900 data points are captured.
 Alerts Utility
By simply clicking on a button, the information is automatically transmitted and evaluated by the Alerts Utility. Our staff will load the data into our Alerts Utility, which evaluates one thousand data points plus additional cross-analysis indicators. Within 48 hours, the acceptable data is posted to the Master Data Set and the hospice is notified via an email message. The email will indicate amounts that are considerably higher or lower than other Hospice programs for your Hospice to focus on. In some cases a few amounts may be so high or low that the data is questionably accurate and we will Exclude the amounts.
 Benchmarking Application
Your data is then available to be queried with the Benchmarking Application whereby a Hospice can input the criteria it wants to compare its performance against, press a button, and the data is pulled from the Master Data Set.
Download the Benchmarking Application »
Safeguards and security measures have been implemented that ensure the confidentiality of data and block the ability to identify individual Hospice providers.
This system helps ensure that Hospices have the tools to be financially viable in order to have adequate resources to provide exceptional care. It builds an accurate and true national financial data base to help set public policy rather than reliance upon Medicare cost reports which do not paint a representative picture of what really happens in a Hospice operationally. It also, provides the almost instantaneous financial benchmarking data that Hospices want and need.
The system is rich in value. Features include:
- Executive Dashboard Reporting – For quick graphical and numeric monitoring of critical performance measures including Growth in ADC, Costs, Clinical Productivity, Visits in Relation to Census, Visit-Hours in Relation to Census, Nursing Home Mix, Benefits %, Debt to Equity Ratio, Development Return Ratio, etc.
- Hospice Homecare, IP Units, and Palliative Care are Tracked in Detail – Each of the most common programs of Hospice organizations are segregated from other programs to provide pure and comparable data.
- Patient-Day and Percentage of Net Patient Revenue Reports – These are the most common methods of Hospice financial measurement. They are excellent for some management decisions, but can be misleading if not viewed with other cost views.
Analysis of Indirect Costs – 50 areas of Indirect Costs are tracked and are grouped into 3 categories; Indirect Labor, Operational Costs, and Facility-Related. Each of the 50 Indirect areas are also tracked individually. - Cost Engineering Tools – These tools allow a Hospice to construct target costs for each component of care based on internally developed standards.
- Flex Model Report – A budget automatically adjusted for fluctuations in patient volume is created through the use of standard costs.
- Breakeven Analysis – Breakeven computations are automatically produced.
- Cost per Visit and Cost per Visit-Hour by Discipline – These cost views provide greater insight into operations and make available the information required by many of the patient-management systems to produce accurate cost views by diagnosis, payer, age, sex, referral source, etc.
- Board Financial Statements – A Balance Sheet and Income Statement are automatically produced in a format that has proved to be very effective for informed decision making by Boards of Directors.
Optional service that can be added onto standard Benchmarking:
 Model Decision Dashboard
This is an additional high value service that maximizes the work invested in creating your Model. In the old days, Hospice operational decisions were slowed as accountants were tasked with analyzing the potential impact of changes. No more. The Decision Dashboard equips Hospice leaders with instantaneous “What-If” analysis capabilities and presents immediate results in a visually stunning format. Read more…
The Benchmarking System and Model Decision Dashboard are provided by Multi-View Incorporated Benchmarking located in Vero Beach, FL.
p: 772-569-9811
1575 Indian River Blvd Suite C220
Vero Beach, FL 32960
info@mvib.net


